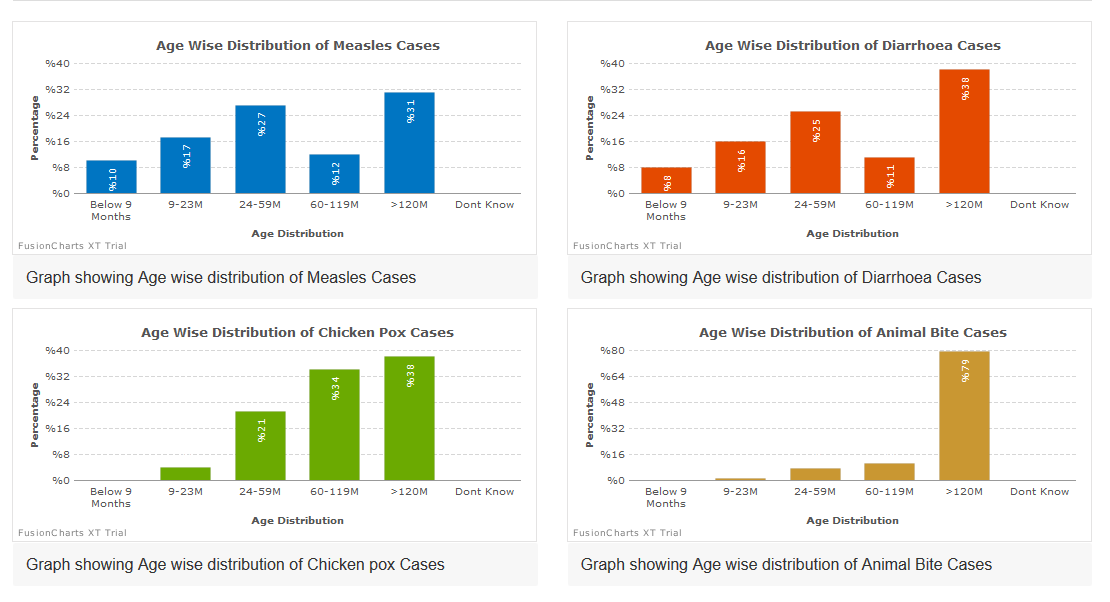
3.5.4 Age Wise Distribution of Suspected Cases
1. This sections shows graphs with information about age wise distribution of suspected cases.
2. Age distribution is shown horizontally from left to right (x-axis) while percentage is shown vertically from bottom to top (y-axis).